
Demo ScreenshotsThe images below have been reduced in size to fit on the page. Click on an image to view it at its normal size.
The Table 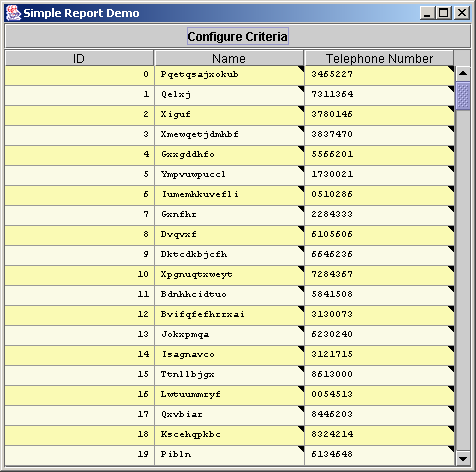
Sorting 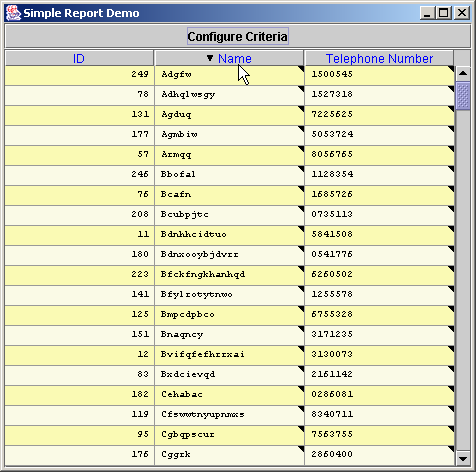
Adding Criteria 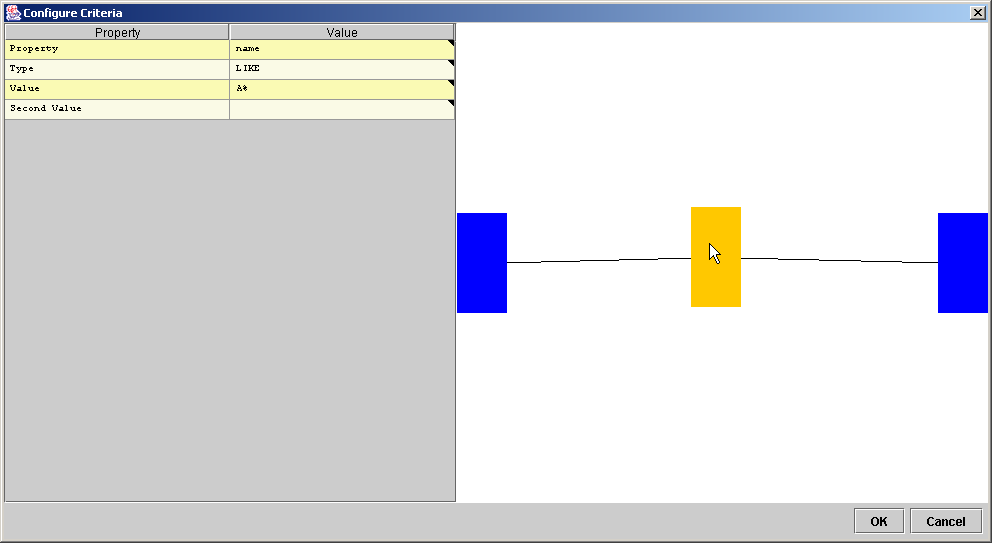
By adding filters in parallel the user can achieve OR criteria. 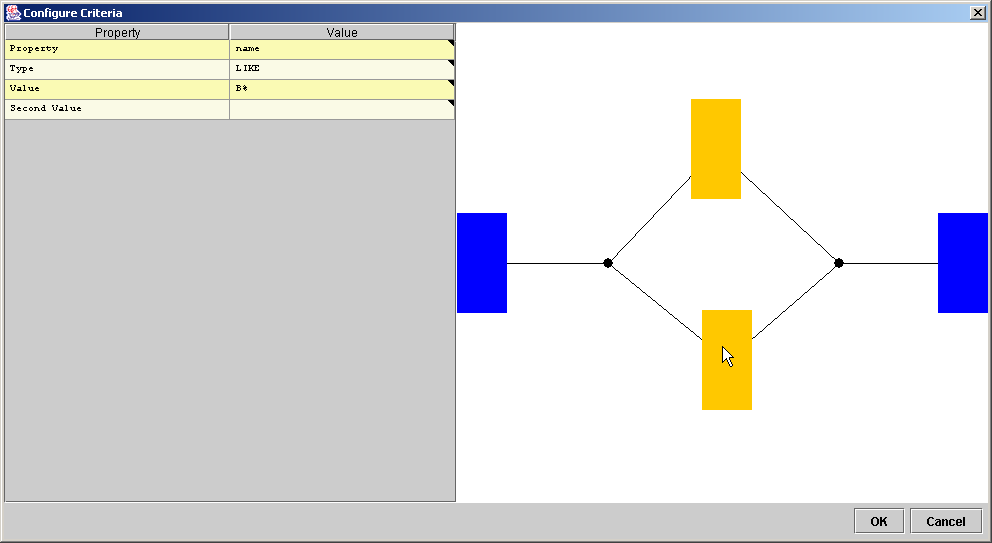
When the filter editor is closed, the rows which match the given criteria are displayed. In the diagram below, only those objects where the name is LIKE 'A%' OR name is LIKE 'B%' are displayed. 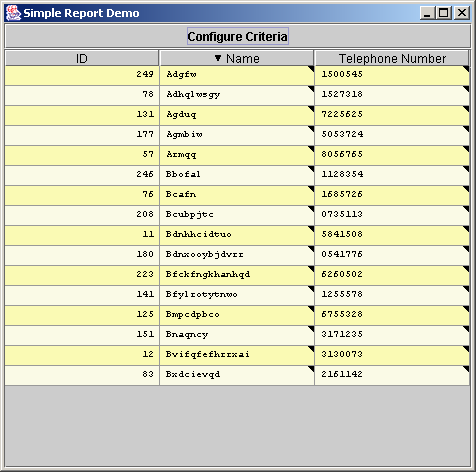
Applying Multiple Criteria 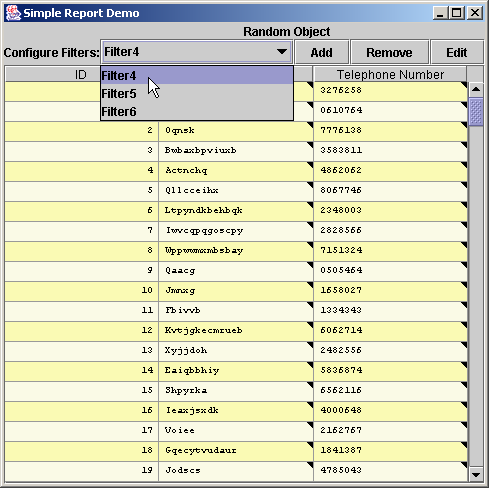
|
Final Project Presentations
10:00am Thursday 23 October in meeting room 731.324.
Demo Screenshots
Updated screenshots of the demo demonstation application are now available. View Screenshots (Word document)
Mid-year Project Presentation
10:00am Thursday 5th June in meeting room 731.324. View Powerpoint Presentation View Summary Document Download mid-year report (Word document) |