|
|
Project Outline
My project is with Kiwiplan NZ Limited. The task is to develop a reporting tool that allows end users to create, customise and view reports from the graphical user interface.
About the Company
Project Motivation
Project Goals
Design Overview
What I Hope to Gain
[Back to top]
About the Company
Kiwiplan is a software development company that services the corrugating and packaging industries. Typical customers include firms that produce corrugated cardboard products such as boxes, display stands, and other packaging products.
Their product range covers the entire business process for a packaging firm, from order entry to shipping. The core products relate to controlling the plant and scheduling the corrugating machinery. These products communicate with the equipment on the factory floor to control production and collect data.
In the 1970's, Kiwiplan was starting business as a small corrugating firm. As their thoughput increased they developed computer systems to help them keep up with demand. There was considerable interest in these computerised systems from other packaging companies, and the IT department grew and eventually separated from the box plant division.
Kiwiplan is now one of the world’s leading software suppliers to the packaging industry. They have customers in 28 countries and four international offices. All research and development work is done in New Zealand.
[Back to top]
Project Motivation
- Kiwiplan's core products are currently character based applications (accessed from a terminal or Telnet session). They are moving these products to graphical user interfaces, which are much more powerful, providing the users with more features in an easy to use way. The reporting tool will become part of these new user interfaces.
- In the company’s experience, most reports arise from a business need to answer a specific question. For example, an employee may need to know a particular sales figure for a month, and so would consult a report to find the answer. Some reports may be used repeatedly, as the same question may arise regularly, but often the user has a question, a report is created and used once, then not looked at again. For such situations, we need to empower the user to build and customise their own reports so that when a question arises they can gain fast access to the information they need, without advanced programming knowledge or having to consult specialised report writing staff.
- Typically reports for management display summary information, showing totals and overall trends. The manager may spot a particular figure that seems unusual, and request more detailed information - for example if a monthly sales figure seems much lower or higher than expected, they may want to see the totals for each product. The advantage of reporting to a graphical user interface component, rather to a static report or to paper, is that the manager can gain immediate feedback to their requests for information, allowing for more timely decision making.
[Back to top]
Project Goals
To develop a reporting system which is:
- Flexible
- Powerful
- Able to be integrated into new Kiwiplan products
A key difference to typical reporting systems is the ability to report from business objects. Most reporting tools work by connecting to a database and running SQL queries. A growing trend is to support reporting from objects, such as JavaBeans. The motivation in our case is that:
- not all the data is available in a database (for example, some is coming from legacy applications);
- we can maintain data integrity by only allowing users to view and update data in the way that the programmer intended;
- by viewing the objects in their proper context the information is more meaningful to the user.
Part of my project work will be to evaluate whether this approach is justified.
I will be developing a reporting back-end that takes care of calculations such as finding totals, averages, and other aggregations. We also require support for user defined expressions.
For the front end I will be developing a Swing based table component, which allows the user to customise their report by adding and removing columns, sorting, searching, applying filters, grouping, displaying subtotals, and editing data where appropriate.
An important feature will be the ability to drill down into reports, to view data in more detail.
[Back to top]
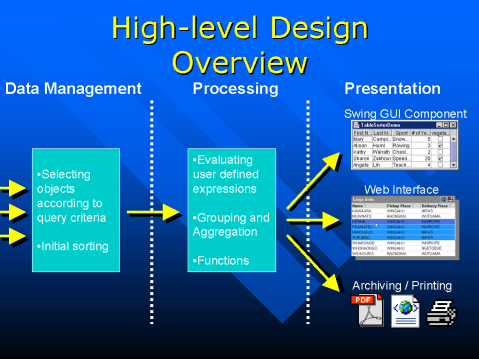
Design Overview
I have identified three main layers to this project, which are fairly typical of the software architectures we have studied.
- Data Management - In this case will be acting on Java objects (rather than a database). This layer is concerned with selecting objects for the report, sorting, and updating where appropriate.
- Processing - Performs the task of building the report from the selected objects. Calculates totals, evaluates user-defined expressions.
- Presentation - Outputs the report to a Swing based component, to a web application, or to some other format for printing, saving, emailing etc.
[Back to top]
What I Hope to Gain
- Practical experience with the software development process. Being able to put into practice the skills I have learnt through University study, and see an application develop through each of the stages, from requirements to implementation.
- Skills in analysis and design. I will be able to compare different design possibilities, evaluate the relative benefits of each, and select the best one.
- Thorough knowledge of reporting systems - what’s required to make a ‘good’ reporting system, and what’s involved in building them.
- Experience with any programming tools and resources that can make my life easier. Reporting in general is a well established field, and rather than re-inventing the wheel, I hope to make use of some existing open source libraries, allowing me to focus on the areas of this project that are new and exciting.
|
Project Report
Click here to go to my project report download page.
Final Project Presentations
10:00am Thursday 23 October in meeting room 731.324.
|