Medical imaging is an essential tool for improving the diagnoses, understanding and treatment of a large variety of diseases. Over the last century technology has advanced from the discovery of x-rays to a variety of 3D imaging tools such as magnetic resonance imaging, computed tomography, positron emission tomography and ultrasonography.
As a consequence the size and complexity of medical data sets has increased tremendously making it ever more difficult to understand, analyze, compare and communicate this data. Visualization is an attempt to simplify these tasks according to the motto ``An image says more than a thousand words''.
This thesis introduces a toolkit for visualizing biomedical data sets with a particular emphasis on second-order tensors, which are mathematically described by matrices and can be used to express complex tissue properties such as material deformation and water diffusion.
The toolkit has a modular design which facilitates the comparison and exploration of multiple data sets. A novel field data structure allows the interactive creation of new measures and boolean filters are introduced as a universal visualization tool. Various new visualization methods are presented including new colour mapping techniques, ellipsoid-based textures and a line integral convolution texture for visualizing tensor fields.
To motivate the design and to assist in the use of the toolkit, guidelines for creating effective visualizations are derived by using perceptual concepts from cognitive science. A new classification for visual attributes according to representational accuracy, perceptual dimension and spatial requirements is presented and the results are used to derive values for the information content and information density of each attribute. A review and a classification of visualization icons completes the theoretical background.
The thesis concludes with two case studies.
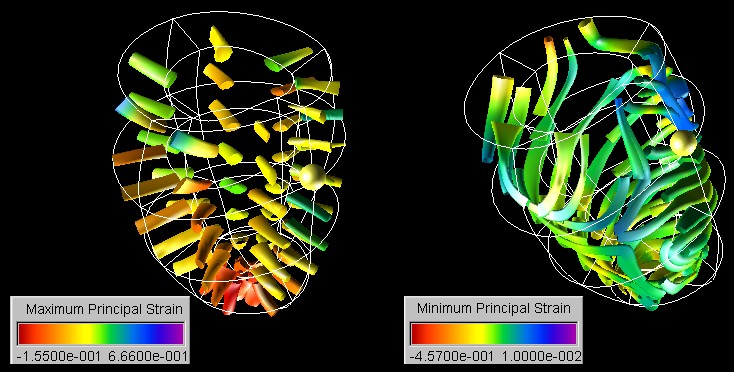
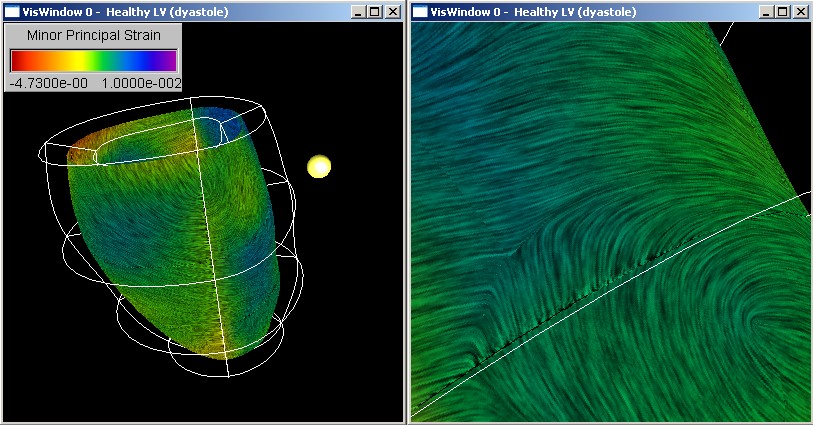
In the first case study the toolkit is used to visualize the strain tensor field in a healthy and a diseased human left ventricle. New insight into the cardiac mechanics is obtained by applying and modifying techniques traditionally used in solid mechanics and computational fluid dynamics.
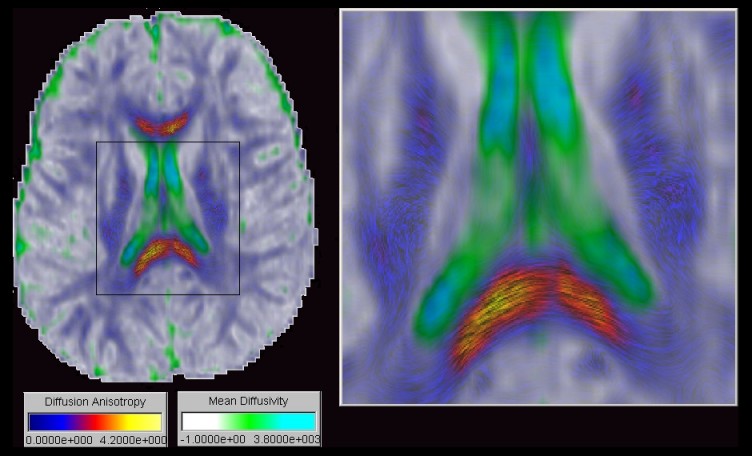
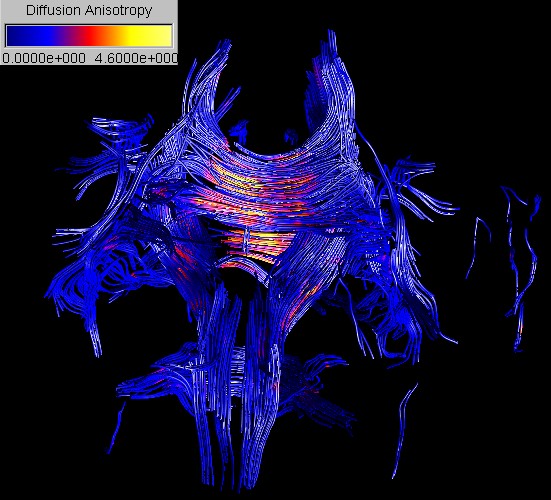
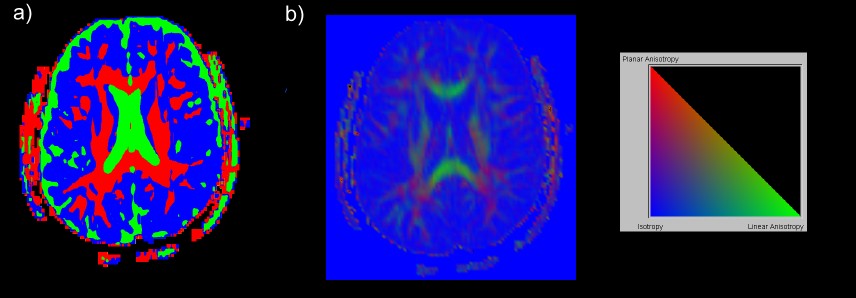
The second case study explores ways to obtain in vivo information of the brain anatomy by visualizing and systematically exploring Diffusion Tensor Imaging (DTI) data. Three new techniques for the visualization of DTI data are presented: Barycentric colour maps allow an integrated view of different types of diffusion anisotropy. Ellipsoid-based textures and Anisotropy Modulated Line Integral Convolution create images segmented by tissue type and incorporating a texture representing the 3D orientation of nerve fibers. The effectiveness of the exploration approach and the new visualization techniques are demonstrated by identifying various anatomical structures and features from a diffusion tensor data set of a healthy brain.
Visualization of Diffusion
Tensor Imaging Data
Diffusion
tensor imaging (DTI) is used to measure the intrinsic properties of water
diffusion in the brain by an orientation invariant quantity, the diffusion
tensor D. By analysing the diffusion tensor field it is possible to reconstruct
and visualize various anatomical structures of the brain as shown in the
images below.
The Visualization and Measurement of Left Ventricular Deformation
While medical
progress has been made in the diagnosis and treatment of heart diseases
it remains the biggest killer in the western world. Cardiovascular diseases
cause considerable morbidity and the prognosis after heart failure is poor.
An improved understanding of cardiac mechanics might advance the diagnosis
and treatment of heart diseases.
We have developed techniques for visualizing and evaluating biomedical finite
element models and we have demonstrated their application to biomedical
data sets by using as an example two models of a healthy and a diseased
human left ventricle.
A Toolkit for Visualizing Biomedical Data Sets
Medical data
sets now comprise a diverse range of measurements such as tissue densities,
sensitivity to magnetization, blood flow velocity, and material strain.
The size and complexity of medical data sets makes it increasingly difficult
to understand, compare, analyze and communicate the data. Visualization
is an attempt to simplify these tasks according to the motto "An image
says more than a thousand words". Representing complex material properties,
such as strain, as a single image improves the perception of features and
pattern in the data, enables the recognition of relationship between different
measures and facilitates the navigation through and interaction with complex
and disparate sets of data.
We have developed a visualization toolkit for exploring complex biomedical
data sets. The tool has a modular design which facilitates the comparison
and exploration of multiple data sets and visualizations. The tool accepts
as input a wide variety of data sets including finite element models for
which fields can be represented both in material and world coordinates.
A novel field data structure allows interactive creation of new fields and
boolean filters function as a universal visualization tool. A wide variety
of visualization techniques are implemented and several improvements and
new techniques have been developed.
 |
 |
Top