Visualization of Diffusion Tensor Imaging Data
Diffusion tensor imaging (DTI) is used to measure the intrinsic properties
of water diffusion in the brain by an orientation invariant quantity, the
diffusion tensor D. This is possible since the spatial distribution of water
molecules originating at a point location after an infinitesimal time period
is described by an ellipsoid. The lengths and orientations of the principal
axes of this diffusion ellipsoid are given by the eigenvalues and eigenvectors,
respectively, of the symmetric second-order tensor D which is represented
by a symmetric 3x3 matrix.
In the brain DTI can be used to differentiate two types of structures. Fluid
filled compartments are characterized by a very high isotropic diffusion,
ie. the diffusion is similar in all directions. In contrast white matter consists
of nerve fibers which restrict the diffusion to one direction only due to
the presence of cell membranes and myelin sheaths surrounding the axons. Fiber
tracts, consisting of parallel nerve fibers, are therefore identified as areas
of a high anisotropic diffusion. The orientation of such fiber tracts is determined
from the principal directions (eigenvectors) of the diffusion tensor. Finally
gray matter consists of neural cell bodies, support cells, intermingling nerve
fibers and connecting contacts, and is characterized by a low, isotropic diffusion.
As an improved visualization method for fiber direction in slice images we
propose transparency modulated Line Integral Convolution. Line Integral Convolution
(LIC) has been originally proposed by Cabral and Leedom as a method to visualize
vector fields by convolving a noise texture with the field. We use the principal
diffusion direction as a vector field but additionally define transparency
values inversely proportional to the diffusion anisotropy in order to remove
regions not corresponding to white matter. The resulting texture is then blended
with a colour mapped image of the mean diffusivity. The three dimensional
direction of a nerve fiber is encoded by varying the length of a convolution
kernel with the normal component of the principal diffusion direction.
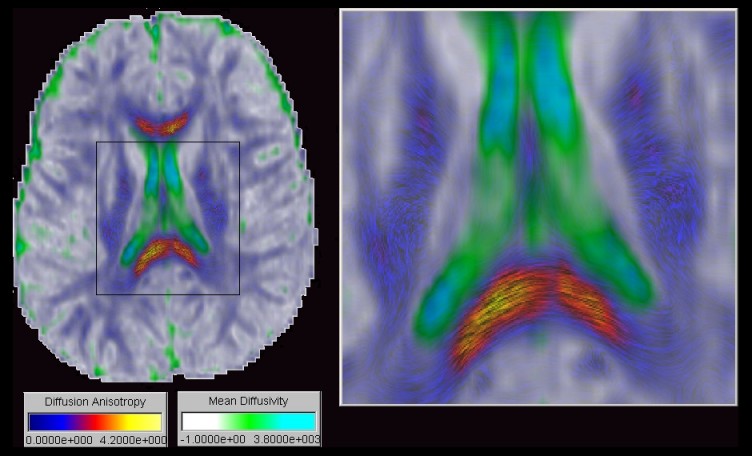 |
Using this technique the colour coding of the resulting image provides a segmentation by tissue type as demonstrated in the figure. The cyan and green regions represent areas of high mean diffusivity and low anisotropy and therefore indicate fluid filled compartments. The whitish regions represent areas of low anisotropy and low mean diffusivity and therefore indicate gray matter. Textured regions exhibit a high anisotropy and indicate white matter. Very long texture components indicate fiber tracts parallel to the image plane, eg. the splenium of the corpus callosum. In contrast a noise-like texture with very short texture components indicates fiber tracts almost orthogonal to the image plane, \eg the external capsule (1).
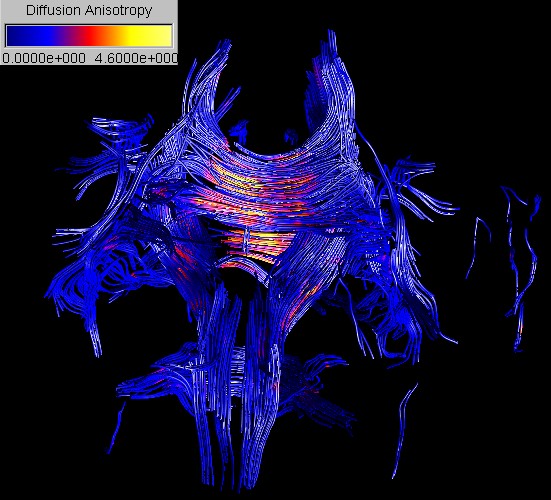 |
A 3D representation
of nerve fiber tracts can be achieved by integrating streamlines along the
principal diffusion in regions of high diffusion anisotropy. In order to
improve the 3D perception of the streamlines we fit cylindrical tubes around
them.
Acknowledgements
We would like to thank Peter J. Basser from the National Institute of Health, Bethesda, MD, for valuable discussions and Carlo Pierpaoli for providing us with the diffusion tensor data set of a healthy brain.
Last
Modified: 01/22/2003 14:51:59 by Burkhard Wünsche (Wuensche)