The Visualization and Measurement of Left Ventricular Deformation
Heart disease remains the biggest killer in the western world. One or multiple
heart diseases can result in heart failure, which is a clinical syndrome that
arises when the heart is unable to pump sufficient blood to meet the metabolic
needs of the body at normal filling pressures. The goal of recording and visualizing
cardiac data sets is to recognize and predict heart diseases.
In this work we use a finite element model of the human left ventricle which
was obtained from a series of tagged MRI images. The deformation of the myocardium
(heart muscle) is represented by the strain tensor.
Computing Volume Measures
The volume of a single finite element is obtained by integrating the identity
function over the finite element in world coordinates. The calculation is
simplified by using the substitution rule of multi-dimensional integration.
 |
One
of the most important measures of cardiac performance is the ventricular (blood)
volume and the fraction of blood ejected during contraction. In order to apply
the volume computation introduced above the left-ventricular cavity must be
modeled by finite elements. Using our toolkit we can define centroids for
any four vertices on the endocardial surface with common longitudinal material
coordinate. Connecting these vertices to the corresponding points on the endocardial
surface results in 16 finite elements for the left ventricular cavity. The
figure below shows the finite element models of the ventricular cavity of
the healthy heart at end-diastole and end-systole.
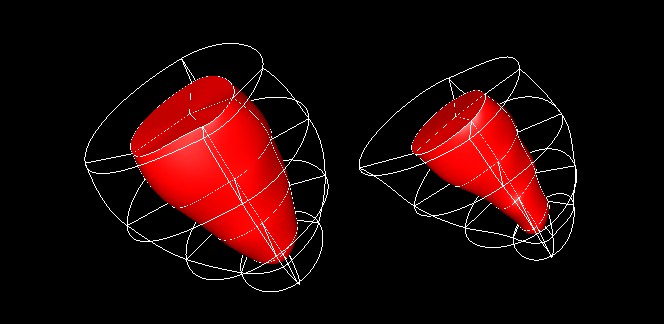 |
Using these models we compute that the ventricular volume of the healthy heart at end-diastole is about 87 cm^3 and the stroke volume is 52 cm^3 resulting in an ejection fraction of about 60%. These values correspond well with data reported in the medical literature.
Visualizing
Myocardial Strain
A one-dimensional
continuous representation of the strain tensor is achieved using hyperstreamlines.
The trajectory of a hyperstreamline is a streamline in the eigenvector field,
ie. the trajectory is obtained by starting at a point and integrating in the
direction of the selected eigenvector. The other two eigenvectors and corresponding
eigenvalues define the axes and lengths of the ellipsoidal cross section of
the hyperstreamline. The remaining eigenvalue is colour mapped onto the hyperstreamline.
The figure below shows hyperstreamlines in the direction of the major (left)
and minor principal strain (right), respectively.
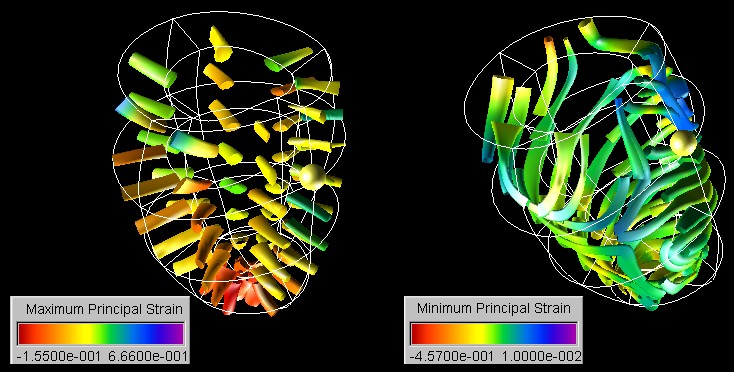 |
The images show clearly that for the healthy heart the major principal strain is positive (see colour scale) and oriented in radial direction throughout the myocardial wall. Furthermore it can be seen from the diameter of the cross section of the hyperstreamline that with the exception of the septal wall the magnitude of the transverse strains increases from the epicardial to the endocardial surface. We are not aware of any previous work showing all these properties with a single image.
The minimum principal strain of the healthy left ventricle is compressive throughout most of the myocardium and its direction resembles over most of the myocardium a spiral moving towards the apex. This strain direction corresponds well with the motion of the heart described in the medical literature. Note that we have in the inferior-septal region an interesting feature where the hyperstreamlines change suddenly their direction.
This feature can be examined in more detail using a line integral convolution texture. Line Integral Convolution (LIC) was originally proposed by Cabral and Leedom as a method to visualize vector fields by convolving a noise texture with the field. We use the direction of the minor principal strain as a vector field and use its magnitude to colour map the texture.
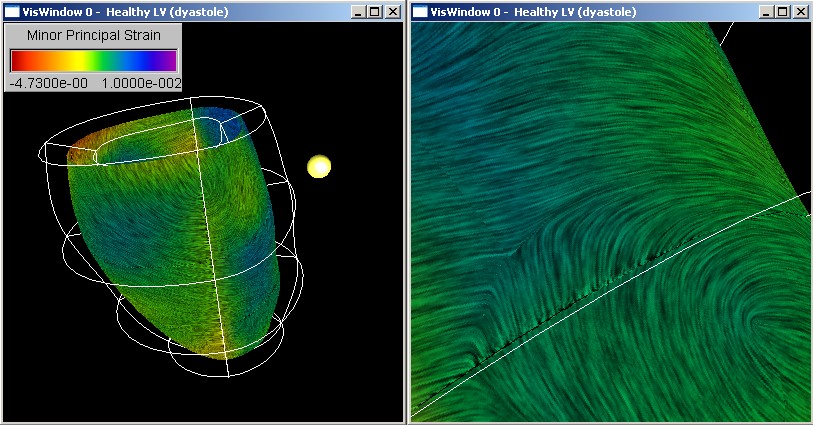 |
The figure above
shows that the maximum compressive strain in the midmyocardium is predominantly
oriented in circumferential direction with a slight downward tilt. Several
interesting points exists where the strain suddenly changes direction. Results
from tensor analysis show that these points are degenerate points for which
at least two eigenvalue are equal. An example of such a point is indicated
by the white rectangle and is shown enlarged on the right hand side of the
image. We found that most of the degenerate points occur on or near the
septal wall. The unusual variations in strain orientation might be caused
by the right ventricular wall which is connected to the left ventricular
wall at both sides of the septum.
Acknowledgements
We would like to thank Alistair A. Young from the Department of Physiology and the Department of Anatomy with Radiology of the University of Auckland, Auckland, New Zealand, for valuable discussions and for providing us with the models of the left ventricle.
Last Modified: 01/22/2003 15:02:53 by Burkhard Wünsche (Wuensche)