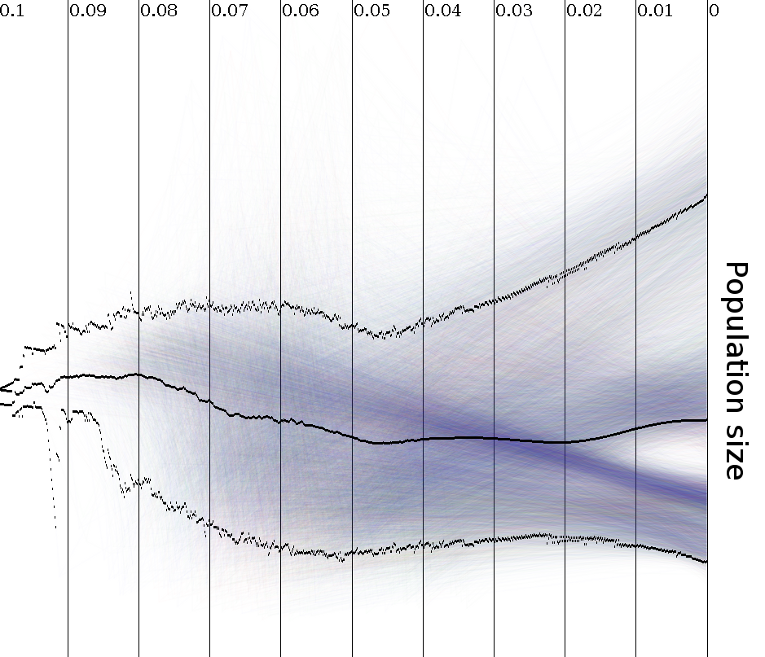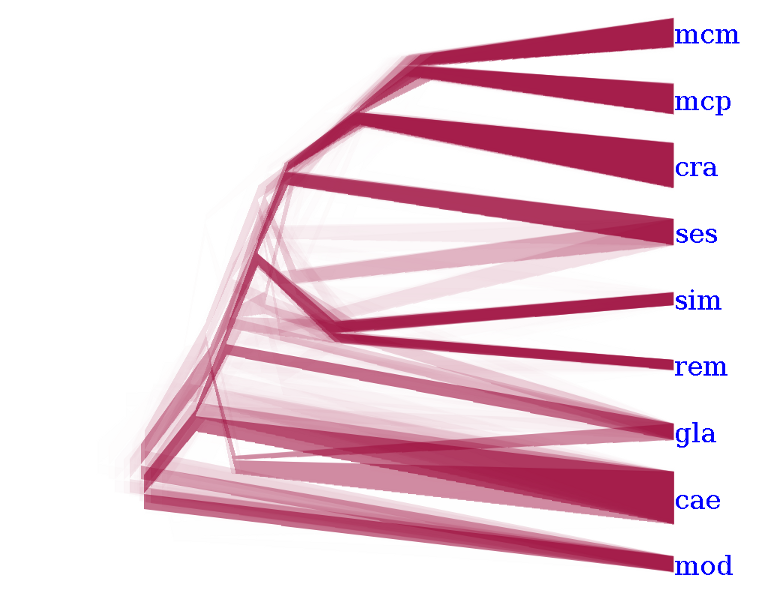
Often, an analysis does not only produce a tree, but also information on branches of a tree such as population size, mutation or migration rates. DensiTree can visualise such meta-data in two ways; by using the width of the line with which a branch is drawn as indication of the meta-data, or by positioning the nodes in a tree at a height proportional to the meta-data.
To use meta-data for line width, click the menu Settings/Meta Data/Use meta data for line width/.
Meta-data is encoded in NEXUS tree files using comments. For example, a tree (1:0.1,2:0.1) can have population size attached using (1[&popsize=12.33,popsize2=22.44,rate=1.10]:0.1,2[&popsize=1.222e-2,popsize2=0.44,rate=2.10]:0.1). Here, the first node has population size 12.33 and the second node 1.222e-2. Furthermore, a second population size and a rate is defined for each branch.
By default, the top of a branch will be as wide as the bottom of a branch. Meta-data can be used for both top and bottom of a line. To specify which meta-data item is used, DensiTree ignores all labels and splits the list into a sequence of numbers. Just specify the index of the sequence for the bottom and for the top through the menu Settings/Meta Data/Bottom Pattern Number and Settings/Meta Data/Top Pattern Number
When drawing a tree, the height of the nodes is determined by the topology of the tree. This leaves one dimension to position the node. Meta-data on a branch can be used to determine this other dimension. Which meta-data item is used is determined by the bottom pattern number (through the Settings/Meta Data/Bottom Pattern Number menu).
To use meta-data to position internal nodes, use one of the node ordering methods under the "Edit/Shuffle/By meta data" items.