A Toolkit for Visualizing Biomedical Data Sets
The past decades have seen the introduction of a variety of medical imaging
modalities such as as magnetic resonance imaging (MRI), computed tomography
(CT), positron emission tomography (PET) and ultrasonography. In recent years
this development has accelerated and a variety of new techniques for measuring
tissue properties, fiber orientation and functional processes have been proposed.
Consequently the available medical data sets now comprise measurements ranging
from scalar fields such as tissue density (x-ray) and water content (MRI)
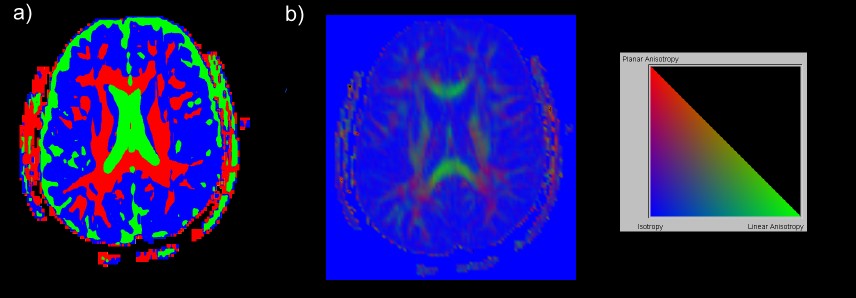
to vector fields, such as blood flow velocity, and tensor fields such as myocardial
strain and cellular water diffusion.
The size and complexity of medical data available today makes it difficult
to analyze and to understand them. This is particularly true for multi-dimensional
data such as vector and tensor fields, and for the simultaneous analysis of
multiple data sets such as MRI, PET and CT. The understanding of the data
can be improved by visualizing it.
We have developed a toolkit for visualizing biomedical data sets and finite
element models which are becoming increasingly important for understanding
and simulating organ function and diseases. Using the finite element data
structure allows the definition of tissue properties in material coordinates,
enables the selection of important structural components of the modeled organ
(such as the inside or outside surface of the heart) and facilitates the computation
of performance measures.
 |
The top-level control of the visualization toolkit manages lists of models, visualization controls, visualization windows, rendering controls, and colour maps which are used for the creation of visualization icons. The figure above shows a screen shot of the toolkit at work.
Data fields can be specified in different coordinate systems and new fields can be derived interactively using a special field data structure. The graphical user interface for field creation, pictured on the right of the figure below contains three output text components listing the currently defined scalar, vector and tensor fields. The user can create a new field by typing a simple mathematical expression into the input text field below.