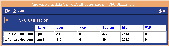
 Area |
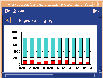
 Bar |
 Pie |
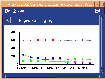 Plot |
 Stack Bar |
|
Each performance metric can be displayed in several display types. Display types are chosen from the option menus to the right of each metric in the main window. Click on the icons below to see examples of each display type:
|
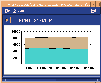
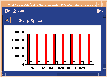
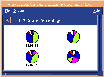
Area |
Bar |
Pie |
|
Plot |
Stack Bar |
|
When a new session is opened, all displays are shown in the session window; however, individual displays can be expanded, collapsed, or "floated out" in their own separate windows.
To expand or collapse a display
To float a display
From the toolbar, choose choose the first flag icon, Float Selected Display, or from the session window's File menu, choose Current Display, then choose Float.
The display now appears in its own window.
You must save a session after floating displays if you want the displays to appear in their own windows when the session is reopened.
Floating displays can be closed so that they reappear in the session window.
To consolidate a floating display into the session window
The display now appears in the session window.
A visual alert icon by the title displays the State (crossed or not crossed, waiting for data, data request timed out) of the threshold.
You can change the data styles chosen for the Performance Manager displays by modifying the PM resource file. The resource file is in this location:
/usr/lib/X11/app-defaults/PM
A copy of the resource file is included in the reference section of the Performance Manager Help Volume.
The following information may help you work with the resource file:
The XrtDataStyle data structure contains all the information about how a set of data will be represented graphically. The fields are broken down as follows:
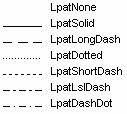 lpat:
lpat:
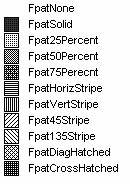 fpat:
fpat:
color:
width:
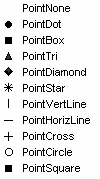 point:
pcolor:
psize:
For further information on resource files and their usage, please see your Xt Intrinsics documentation.
Resources of type (XtRXrtDataStyles) are specified as a parenthesized list, with each member specifying a complete data style (XtRXrtDataStyle). For example:
  ! change the graph data styles
  pmgr*xrtDataStyles: (( LpatSolid FpatSolid "blue" 1 PointDot "blue" 4 ) \
  ( LpatSolid FpatSolid "yellow" 1 PointTri "yellow" 4 ) \
  ( LpatSolid FpatHorizStripe "magenta" 1 PointBox "magenta" 4 ) \
  ( LpatSolid Fpat25Percent "cyan" 1 PointDiamond "cyan" 4 ) \
  ( LpatSolid FpatVertStripe "#6699ff" 1 PointStar "#6699ff" 4 ) \
  ( LpatSolid FpatDiagHatched "#ff9900" 1 PointCircle "#ff9900" 4 ) \
  ( LpatSolid Fpat45Stripe "#33cc99" 1 PointSquare "#33cc99" 4 ) \
  ( LpatSolid FpatCrossHatched "#cc3333" 1 PointCross "#cc3333" 4 ))
| Back to the User's Guide home page |
|---|
| Return to: |
| Monitoring |