Ladebug provides advanced debugging techniques for debugging your multiprocess and multithread applications.
This chapter explains how to:
For more information about multithreaded application debugging, see Chapter 19. For more information on multiprocess application debugging, see Chapter 20.
The Source View Context Panel contains menu buttons that list processes and threads. It allows you to change the process or thread context by selecting any process or thread on the menu and bringing it under debugger control.
To select a process or thread, pull down the Process or Thread menu button and select the process or thread you want. The contents of the Source View and the Call Stack and any displayed optional views are updated to reflect the current context.
For multithreaded applications, when you select a particular process, the thread option menu button then displays the thread list of the current process.
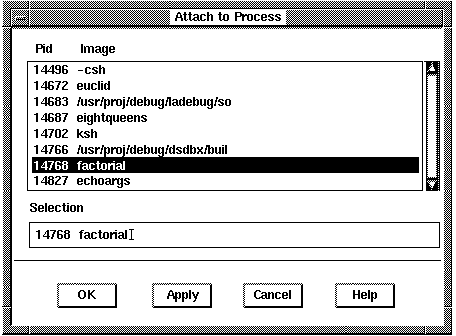
To attach to a process not currently under debugger control, choose Command:Attach to Process in the Main Window. This displays a Process Selection dialog box that shows you the list of active processes to which you have access (Figure 5-1).
Select the process you want to attach to. The Source View reflects the new process. If you have optional views displayed, they will be updated to reflect the new process.
If no breakpoint is set in the process to which you are attaching, the process will run to completion. However, you can set the $stoponattach variable to stop the process right after the debugger attaches to it by default. For more information, see Part V, Command Reference.
The Source View will not reflect the new process if the debugger cannot find the path to the actual source file. See Section 4.1.3 for information about specifying the location of source files.
You can also attach to a process using the load command at the command prompt. The views are not updated until the run command is executed. If a break is not set, the process will run to completion. Use the stop in or stop at command to set a break. For more information, see Section 9.13.
To detach a process, choose Commands:Detach Process in the Main Window. This displays a dialog box showing all the current processes under debugger control.
Click on the desired process to remove it from debugger control. If the process is current (displayed in the Source View and optional views), the process will run to completion and the views are reinitialized (blanked out). If the process you detach is not current, it will run to completion and the current process will continue to display in the Source View.
The views do not close automatically. To close the views, use the Views menu or exit the debugger.
This section describes how to select among several threads in a DECthreads multithreaded application and change the current thread context.
The debugger thread display defaults to DECthreads if the application is multithreaded and uses DECthreads. Otherwise, the $threadlevel is set to native.
For more information on identifying and setting the thread mode, see Chapter 19.
This section shows how to debug a single process multithreaded application.
The general steps for debugging a multithreaded application are as follows:
Ladebug displays the current thread in the Source View.
The Register and Instruction Views show information pertaining to the selected thread. The Breakpoint View does not change when the thread is changed because it displays breakpoints for all processes.
This section describes how to use the debugger window interface to debug a multiprocess application. It presents an example application that forks a child process and execs a program.
Ladebug provides predefined debugger variables that you can set in order to debug multiprocess applications that fork and/or exec. In the example in Figure 5-2, the debugger variables $catchforks, $catchexecs, and $stopparentonfork have been set from the prompt as follows:
(ladebug)set $catchforks=1
(ladebug)set $catchexecs=1
(ladebug)set $stopparentonfork=1
Setting $catchforks to 1 instructs Ladebug to notify the user when a program forks a child process. Setting $catchexecs to 1 instructs Ladebug to notify the user when a program execs. Setting $stopparentonfork to 1 stops the parent process when a program forks a child process.
For more information on debugger variables, see Section 20.7.1. For different scenarios in which these variables are used, see Section 20.7.2 and Section 20.7.3.
The general steps for debugging a multiprocess application are as follows:

You can continue debugging the child process or return to the parent process by selecting it in the process menu pulldown. When the process has finished executing, a message displays that process has exited and the Source View reinitializes (blanks out).