Copyright (c) 1995 Institute of Electrical and Electronics Engineers. Reprinted from Visualization '95, Iconic Techniques for Feature Visualization, pp. 288-295.
Post, Walsum, Post, and Silver described some generic techniques to
generate attribute sets and introduced a modelling language
to create icons and to link the attributes to the icon parameters.
An icon shows essential characteristic of the data in the domain to which
the icon refers. Most icons describe only data in a single point.
However, icons can also describe small point sets.
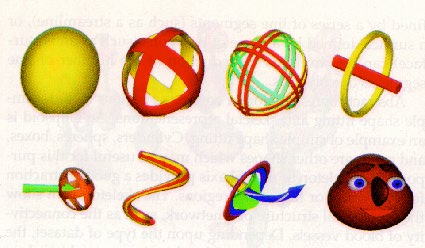
The second item on the left of the bottom row of the above image,
for example, shows an interpolated tube through five points.
The four top icons visualize the Jacobian of a velocity field,
which is a tensor. The bottom left icon shows an average velocity arrow and
a velocity distribution ellipsoid. The tensor probe
is explained in image 2.
The bottom right icon is a 3D Chernoff face, which is used to
describe high dimensional data in an abstract data space, rather than in
an Euclidean physical space.