Copyright (c) 1996 Prentice Hall PTR, Will Schroeder, Ken Martin, Bill Lorensen - The Visualization Toolkit
A vector field can be visualized by warping the geometry of an
object with the vector data.
Similarly it is possible to visualize a stress tensor by
applying it to a unit cube.
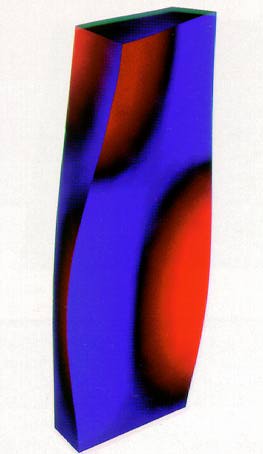
The above image visualizes vibrations by warping a cuboid with
vector data. Additionally a displacement plot is created
by computing the dot product between the vector and the surface
normal at each vertex.
The resulting scalar value is color mapped to show relative
surface motion: red area are moving in the direction of the
surface normal, blue areas in the opposite direction.
The black regions have little or no motion in direction of the
surface normal and are therefore similar to nodal line used to
visualize modes of vibration (in above picture the shown mode
is the second torsional).